
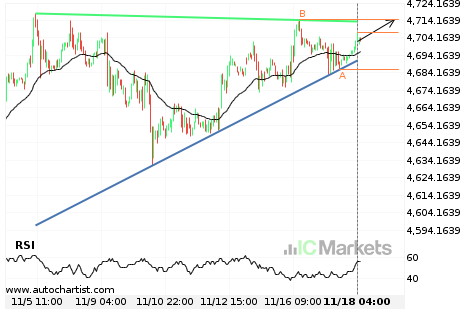
US SPX 500 Index Nível visado: 4714.6000
Triângulo Ascendente identificado em 18-nov-2021 04:00 EST. Este padrão está ainda em processo de formação. Possível previsão de movimento em alta para o nível de 4714.6000 no próximo 3 dias.
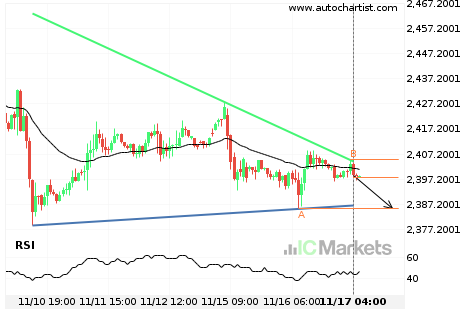
US Small Cap 2000 Index Nível visado: 2385.3800
Triângulo identificado em 17-nov-2021 04:00 EST. Este padrão está ainda em processo de formação. Possível previsão de movimento em baixa para o nível de 2385.3800 no próximo dia.
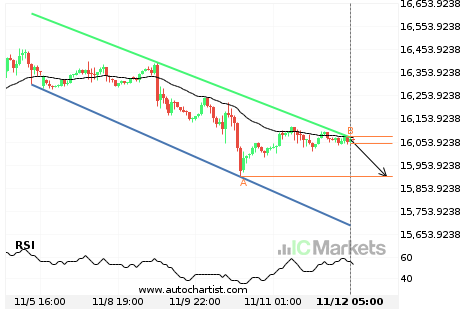
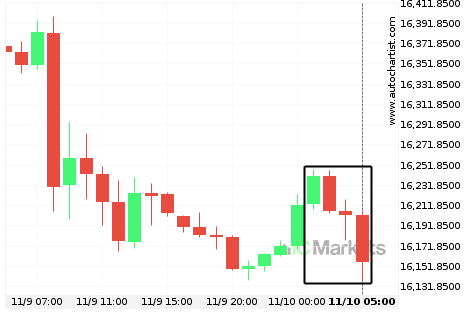
US Tech 100 Index Nível visado: 15903.5000
Canal descendente identificado em 12-nov-2021 05:00 EST. Este padrão está ainda em processo de formação. Possível previsão de movimento em baixa para o nível de 15903.5000 no próximo dia.
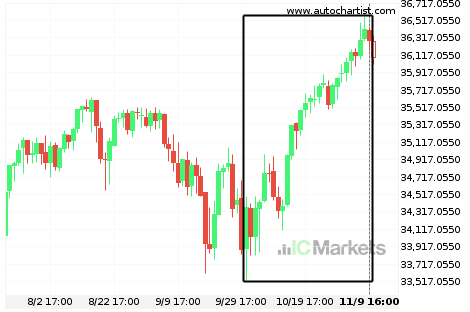
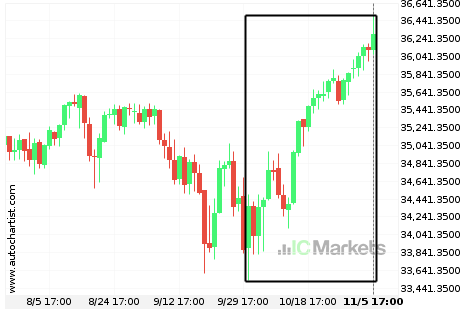
Grande Movimento US Wall Street 30 Index
US Wall Street 30 Index experimentou um 5.58% em alta movimento no(a) último(a) 40 dias.
Grande Movimento US Tech 100 Index
US Tech 100 Index experimentou um 0.52% em baixa movimento no(a) último(a) 4 horas.
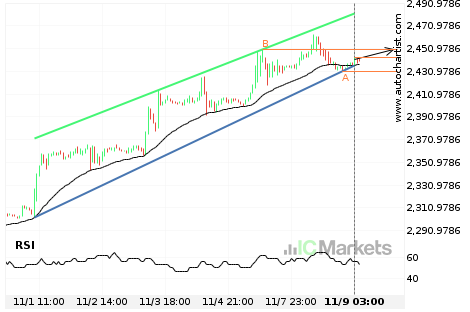
US Small Cap 2000 Index Nível visado: 2450.0100
Canal ascendente identificado em 09-nov-2021 03:00 EST. Este padrão está ainda em processo de formação. Possível previsão de movimento em alta para o nível de 2450.0100 no próximo 2 dias.
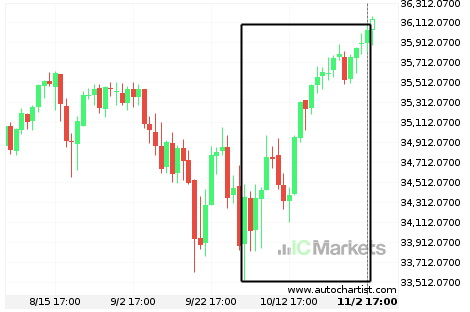
Grande Movimento US Wall Street 30 Index
US Wall Street 30 Index experimentou um 5.61% em alta movimento no(a) último(a) 36 dias.

Grande Movimento AbbVie
AbbVie experimentou um 9.42% em alta movimento no(a) último(a) 16 dias.
Grande Movimento US Wall Street 30 Index
US Wall Street 30 Index experimentou um 4.87% em alta movimento no(a) último(a) 33 dias.

Grande Movimento AbbVie
AbbVie experimentou um 8.45% em alta movimento no(a) último(a) 15 dias.